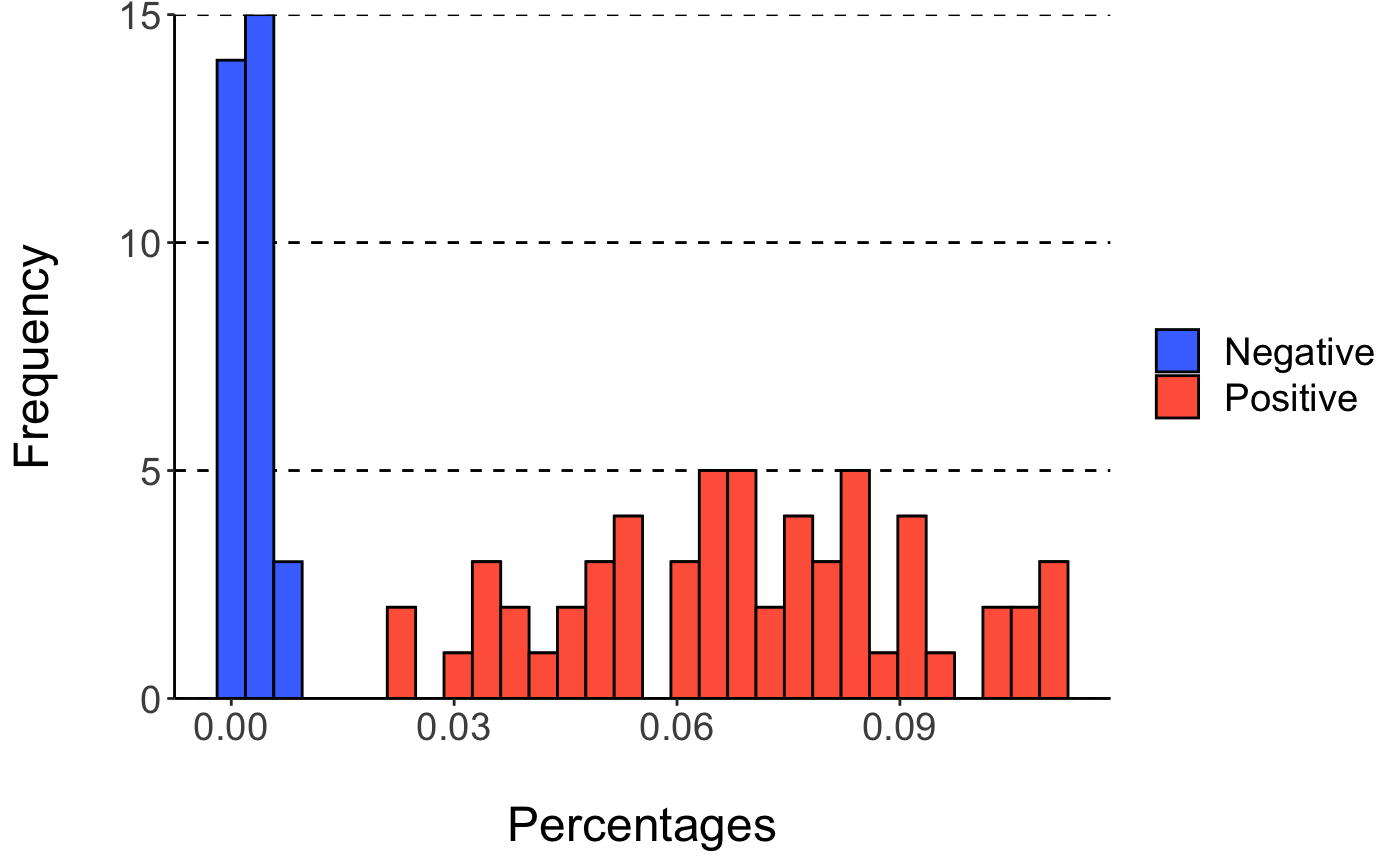
Plot histogram of clonotype frequencies in negative and positive samples.
Source:R/plotHist.R
plotHist.RdPlot histogram of clonotype frequencies in negative and positive samples.
plotHist(comb)
Arguments
| comb | List containing both negtive (n) and positive (v) clonotype percentages. |
|---|
Value
ggplot histogram of clonotype frequencies in negative and positive samples
Examples
FIELD <- "vGeneName aminoAcid jGeneName" COUNT <- "copy" P_CUTOFF <- 0.1 MIN_PUBLIC <- 2 COPY_RANGE <- "1 99" listPos <- tsvDir(system.file("extdata", "Post", package="iCAT")) listNeg <- tsvDir(system.file("extdata", "Pre", package="iCAT")) naive <- readTrn(listNeg, FIELD, COUNT, COPY_RANGE, "naive") vaccs <- readTrn(listPos, FIELD, COUNT, COPY_RANGE, "vacc") mod <- train(naive, vaccs, listNeg, listPos, FIELD, COUNT, COPY_RANGE, P_CUTOFF, MIN_PUBLIC, NULL) plotHist(mod)#>